A polymer will normally have more than one characteristic temperature, including (in the normal ascending order):
- Tg: the glass transition temperature.
- Tm: the crystalline melting point
- Tp: the processing temperature (for thermoplastics).
- Td: the degradation temperature.
As the temperature rises through the glass transition temperature, short segments of the polymer backbone which had insufficient energy for movement other than atomic vibration, start to move as a group of atoms. On cooling through this temperature, it is normal to refer to segmental motion being frozen out. The mechanical properties of the polymer are then:
- below Tg: normally elastic and brittle (with good resistance to creep deformation)
- above Tg: normally viscoelastic and tough (however creep deformation can be a problem)
For thermosetting resins, the glass transition temperature generally follows the maximum temperature experienced during the cure cycle (indicated by "*" in the Table below).
Wright [1] plotted the fall in glass transition temperature for data from epoxy resins (from five separate published papers) as a function of moisture content and found "as a rough rule-of-thumb" that there was a drop of 20°C for each 1% of water pick-up (data available up to 7% moisture content).
The crystalline melting point is not applicable to amorphous polymers and is usually only important in thermoplastics. The crystalline melting point value is normally ~200 (±50) ºC above the glass transition temperature ( Tm ≈ Tg + 200 ºC ). Tm may be a narrow range of temperatures rather than a single point.
Table 1: Transition points for some common polymers
| Polymer |
Chemical name |
Recycle no. |
Tg (deg C) |
Tm (deg C) |
Source |
| EP | Epoxy resin | | * | decomposes |
|
| HDPE | High density polyethylene | 2 | -125 |
130 to 140 | PE poster PX-TA1B |
| LDPE | Low density polyethylene | 4 | -130 |
85 to 125 | PE poster PX-TA1B |
| PA12 | Nylon 12 (polyamide) | | |
160-210 | PE poster PX-TA1B |
| PET | Poly ethylene terephthalate | 1 | 70 to 80 |
245 to 265 | PE poster PX-TA1B |
| PP | Poly propylene | 5 | -20 to -5 |
165 to 175 | PE poster PX-TA1B |
| PS |
Poly styrene |
6 |
90 to 110 |
amorphous |
PE poster PX-TA1B
|
| PVC |
Poly vinyl chloride |
3 |
65 to 85 |
amorphous |
PE poster PX-TA1B
|
| UPE |
Unsaturated polyester resin |
|
* |
decomposes |
|
Additional data on Tg and Tm is available from
Many commercial polymer supplier Product Data Sheets (PDS) quote a Heat Deflection/Distortion Temperature (HDT) rather than the glass transition temperature. ASTM D648 defines the HDT as the temperature at which a sample bar (l=127 x t=13 x w=3-13 mm) deflects by 0.25 mm in three point bending. The load F = 2 P w t2 / 3 L, where P is the maximum flexural stress at the mid-point of the beam and L is the distance between the loading supports being ~100 mm dependent on method. The flexural stress is either 0.455 MPa (66 psi) or 1.82 MPa (264 psi). The HDT of amorphous polymers and thermosets are normally lower than the Tg measured by DMA, DSC or TMA. For such polymers, a general rule-of-thumb suggests:
- Tg = HDT66 + 15 (±5) °C
- Tg = HDT264 + 25 (±5) °C
Thermal characterisation
There are a number of techniques which can be used to
characterise the thermal behaviour of fibre-reinforced composites:
Table 2: the role of the different thermal analysis techniques (based on an unidentified supplier’s Thermal Analysis Application Guide)
Prajer (PhD thesis, University of Bath, 2011) characterised the thermal behaviour of polylactic acid (PLA) using a TA Instruments DSC2920 Differential Scanning Calorimeter. Figure 1 shows the response of material when melted at 190°C for 10 minutes then either air-quenched (left) or cooled at 5°C/min to 115°C then kept at temperature for 40 minutes
(right). The fast cooling rate suppresses crystallinity development in the quenched polymer so that the temperature ramp during DSC records a strong glass transition at ~60-70°C and a peak crystallisation temperature at about 120°C. In the slowly cooled partially crystalline sample, the glass transition temperature is suppressed and there no crystallisation peak. The crystalline melting point is in the range 160-180°C and moves to a slightly higher peak temperaure for the crystalline material.
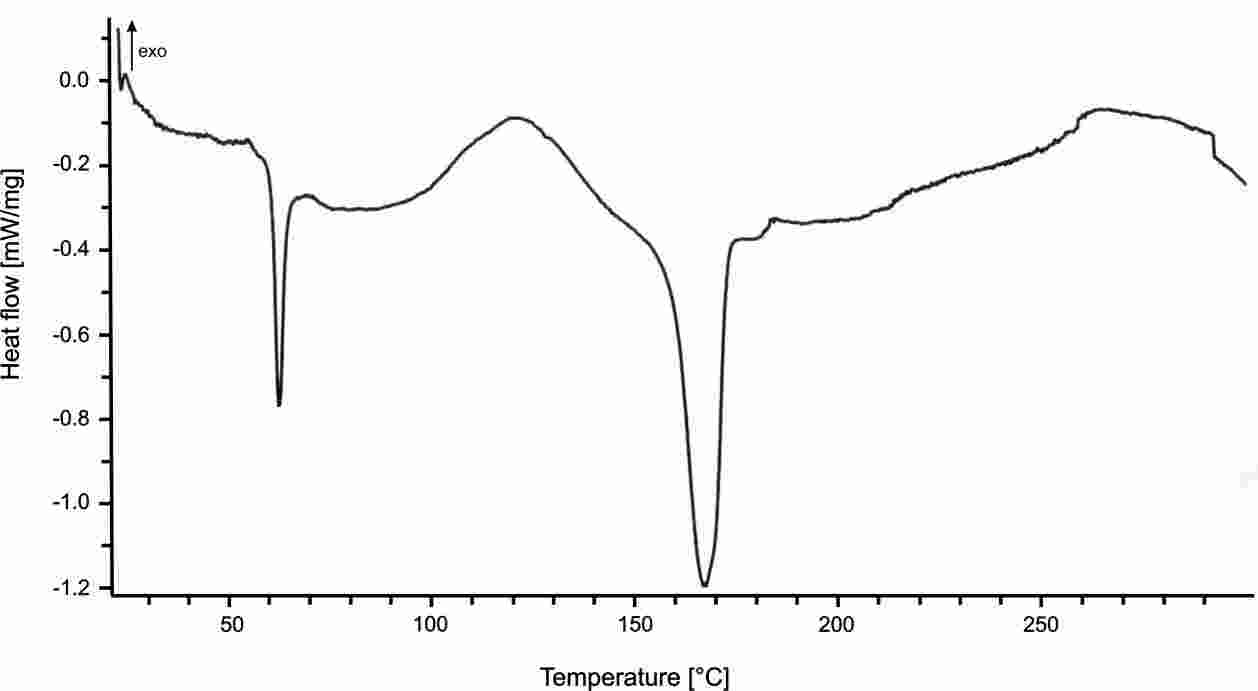
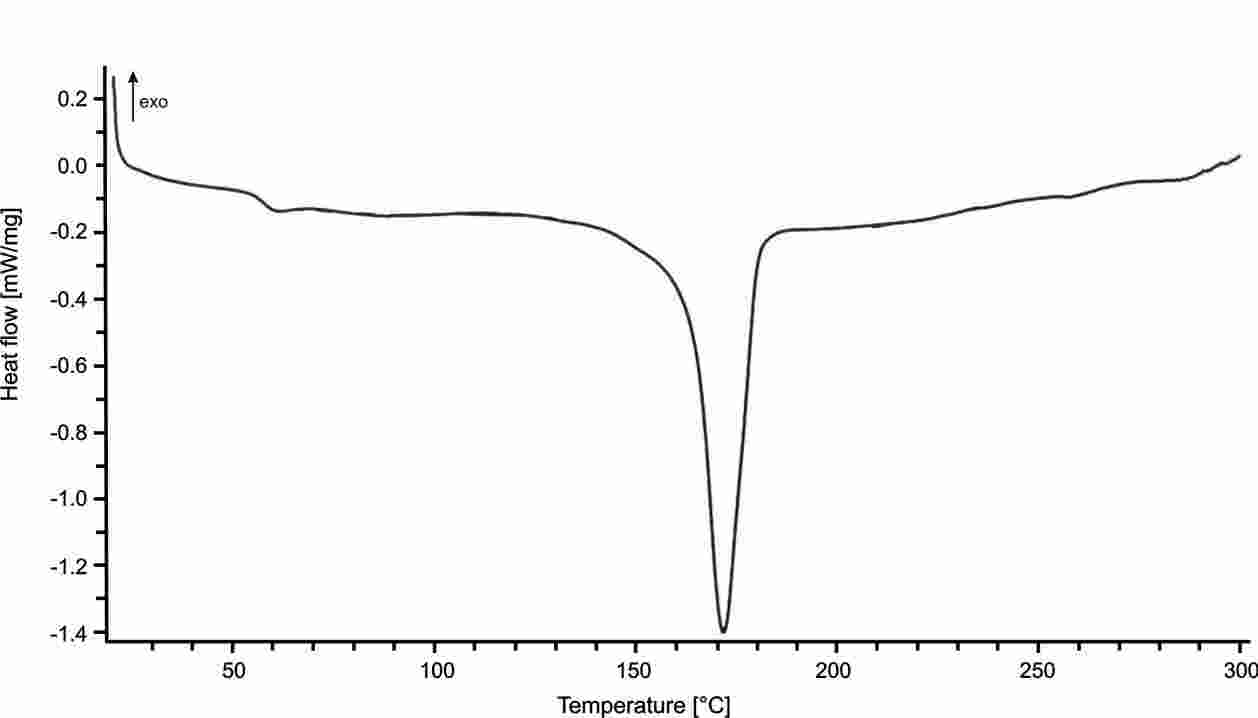
Figure 1: Differential scanning calorimeter thermal response plots for quenched/amorphous (left or above) and crystalline (right or below) polylactic acid
(reproduced here with the permission of Dr Prajer).
Further reading
- WW Wright, The effect of diffusion of water into epoxy resins and their carbon fibre reinforced composites, Composites, July 1981, 12(3), 201-205.
- David Richard Mulligan, Samuel Gnanih and Graham Sims, Thermal Analysis Techniques for Composites and Adhesives (Second Edition), National Physical Laboratory Good Practice Guide (GPG No. 62), Teddington, 2000.
- Wim M Groenewoud, Characterisation of polymers by thermal analysis, Elsevier, Amsterdam, 2001. ISBN 0-444-50604-7.
- Peter J Haines, Principles of thermal analysis and calorimetry, Royal Society of Chemistry, Cambridge, 2002. ISBN 0-85404-610-0. PU CSH Library
- JD Menczel and RB Prime, Thermal Analysis of Polymers - fundamentals and
applications, Wiley, 2009. ISBN 978-0-471-76917-0.
- Plastics - differential scanning calorimetry (DSC). Part 1: general principles, BS ISO 11357-1:1997.
- Plastics - differential scanning calorimetry (DSC). Part 2: determination of glass transition temperature, BS ISO 11357-2:1999.
- Plastics - differential scanning calorimetry (DSC). Part 3: determination of temperature and enthalpy of melting and crystallization, BS ISO 11357-3:1999.
- Plastics - differential scanning calorimetry (DSC). Part 5: determination of characteristic reaction curve temperatures and times, enthalpy of reaction and degree of conversion, BS ISO 11357-5:1999.
- Plastics - thermogravimetry (TG) of polymers. General principles. BS EN ISO 11358:1997.
- Plastics - thermomechanical analysis (TMA). General principles. BS ISO 11359-1:1999.
- Plastics - thermomechanical analysis (TMA). Determination of coefficient of linear thermal expansion and glass transition temperature. BS ISO 11359-2:1999.
UserCom (Mettler Toledo thermal analysis systems) TA Tips (download MT Thermal Analysis Tips and Hints)
- Anonymous, Different temperatures, UserCom 1, May 1995, 1-2.
- Anonymous, Selection of the heating rate: influence on sensitivity, resolution and temperature accuracy, UserCom 2, December 1995, 1-2.
- Anonymous, Investigation of unknown samples: sample preparation and experimental conditions, UserCom 3, July 1996, 1-2.
- Anonymous, Optimum utilization of the internal database: extensive data management features (e.g. storage, search, filter), UserCom 4, December 1996, 1-3.
- Anonymous, Crucibles in Thermal Analysis: application benefits offered by Al, Al2O3, Cu, Au, Pt and pressure pans,
UserCom 5, June 1997, 1-4.
- Anonymous, Calibration adjustment, calibration and reference substances: ADSC sample preparation and program parameters, UserCom 6, December 1997, 1-5.
- Anonymous, Measuring specific heat capacity: comparison of different methods - direct Cp, sapphire method, steady state and sinusoidal ADSC, UserCom 7, June 1998, 1-5.
- Anonymous, Tips on Model Free Kinetics: benefits, practical procedures and evaluations - crucibles for high temperature TGA, UserCom 8, 2/1998, 1-3.
- Anonymous, Low temperature calibration: calibration substances for the range between –130 to 156°C, UserCom 9, 1/1999, 1-4.
- Anonymous, DSC purity determination, UserCom 10, 2/1999, 1-5.
- Anonymous, Interpreting DSC curves, Part 1: dynamic measurements - artifacts, conditions, physical transitions, lambda transitions, chemical reactions, UserCom 11, 1/2000, 1-7.
- J Widmann, Interpreting DSC curves: isothermal measurements, crystallization, desorption, vaporization, drying, chemical reaction, UserCom 12, 2/2000, 1-4.
- G Widmann, Interpreting TGA curves: gravimetric effects caused by mass losses and gains, melting, magnetic sample properties, buoyancy, experimental condition changes, UserCom 13, 1/2001, 1-4.
- G Widmann, Interpreting TMA curves: dilatometry, TMA and dynamic load TMA, UserCom 14, 2/2001, 1-4.
- G Widmann, J Schawe and R Riesen, Interpreting DMA curves, Part 1: advanced model free kinetics - IsoStepTM,
UserCom 15, 1/2002, 1-6.
- J Schawe, Interpreting DMA curves, Part 2: complex modulus and compliance - the frequency dependence of modulus and compliance, UserCom 16, 2/2002, 1-5.
- R Riesen and Jurgen Schawe, The glass transition temperature measured by different TA techniques, Part 1: overview, UserCom 17, 1/2003, 1-4.
- R Riesen and J Schawe, The glass transition temperature measured by different TA techniques, Part 2: determination of glass transition temperatures, UserCom 18, 2/2003, 1-5.
- M Wagner, R Bottom, P Larbanois and J Schawe, DSC measurements at high heating rates - advantages and limitations, UserCom 19, 1/2004, 1-5.
- Ni Jing, The advantages of DSC cooling measurements for characterizing materials, UserCom 20, 2/2004, 1-4.
- M Schnubell, Method development in thermal analysis, Part 1, UserCom 21, 1/2005, 1-4.
- M Schnubell, Method development in thermal analysis , Part 2, UserCom 22, 2/2005, 1-4.
- M Schnubell, How to determine optimum experimental parameters for DMA measurements, UserCom 23, 1/2006, 1-5.
- M Zappa, Influence of absorbed water on the mechanical properties of polyamide 6, UserCom 24, 2/2006, 1-5.
- R Riesen, Choosing the right baseline, UserCom 25, 1/2007, 1-6.
- J Schawe, Optimum choice of method and evaluation in DMA measurements of composites, UserCom 26, 2/2007, 1-4.
- R Riesen, Heat capacity determination at high temperatures by TGA/DSC, Part 1: DSC standard procedures, UserCom 27, 1/2008, 1-4.
- R Riesen, Heat capacity determination at high temperatures by TGA/DSC, Part 2: applications, UserCom 28, 2/2008, 1-4.
- M Zappa, Analytical measurement terminology in the laboratory. Part 1: trueness, precision and accuracy, UserCom 29, 1/2009, 1-7.
- M Zappa, Analytical measurement terminology in the laboratory. Part 2: uncertainty of measurement, UserCom 30, 2/2009, 1-5.
- A Hammer, Thermal analysis of polymers. Part 1: DSC of thermoplastics, UserCom 31, 1/2010, 1-6.
- A Hammer, Thermal analysis of polymers. Part 2: TGA, TMA and DMA of thermoplastics, UserCom 32, 2/2010, 1-5.
- A Hammer, Thermal analysis of polymers. Part 3: DSC of thermosets, UserCom 33, 1/2011, 1-5.
- A Hammer, Thermal analysis of polymers. Part 4: TGA, TMA and DMA of thermosets, UserCom 34, 2.2011, 1-5.
- J Ni and A Hammer, Thermal analysis of polymers. Part 5: DSC and TGA of elastomers, UserCom 35, 1/2012, 1-6.
- J Ni and A Hammer, Thermal analysis of polymers. Part 6: TMA and DMA of elastomers, UserCom 36, 2/2012, 1-6.
- M Schubnell and A Hammer, Sorption experiments with the TGA/DSC 1, UserCom 37, 1/2013, 1-5.
- J Schawe, Curve interpretation part 1: Variation of expertimental conditions, UserCom 38, 2/2013, 1-7.
- J Schawe, Curve interpretation, Part 2: Variation of heating and cooling rates, UserCom 39, 1/2014, 1-7.
- M Schubnell, Curve interpretation, Part 3: DSC curves and curves from other thermal analysis techniques, UserCom 40, 2/2014, 2-6.
- M Schubnell, Curve interpretation Part 4: TGA measurements, UserCom 41, 1/2015, 1-8.
- M Nijman, Curve interpretation Part 5: TMA curves, UserCom 42, 2/2015, 1-7.
- J Schawe, Curve interpretation, Part 6: Variation of DMA measurement conditions, UserCom 43, 1/2016, 1-7.
- J Schawe, Curve interpretation, Part 7: DMA combined with results from other thermal analysis techniques, UserCom 44, 2/2016, 1-6.
- M Schubnell, Thermogravimetry and gas analysis, Part 1: Basic principles and overview, UserCom 45, 1-10
- A Hammer, Thermogravimetry and gas analysis, Part 2: TGA-MS, UserCom 46, 1-5.
- M Nijman, Thermogravimetry and gas analysis. Part 3: TGA/DSC-FTIR, UserCom 47, 1/2018, 1-6.
- N Fedelich, Thermogravimetry and gas analysis, Part 4: TGA-GC/MS, UserCom 48, 2/2018, 1-7.
- N Fedelich, Thermogravimetry and gas analysis, Part 5: TGA-micro GC/MS, UserCom 49, 1/2019, 1-7.
- N Fedelich, Measurement of the expansion behavior of materials with a low coefficient of thermal expansion by TMA, UserCom 50, 2/2019, 1-6.
- M Schubnell, C De Caro and R Kunz, Moisture content, water content, loss on drying, Part 1: What exactly is meant and how are these quantities determined?, UserCom 51, 1/2020, 1-8.
- M Schubnell and A Hammer, Moisture content, water content, loss on drying, Part 2: Special possibilities using the TGA, UserCom 52, 2/2020, 1-5.
- M Schubnell and D Regonini, Calibration and adjustment of DSCs, Part 1: Which materials are suitable?, UserCom 53, 1/2021, 1-6.
- T Dennenwaldt and J Stromer, Isothermal calibration and adjustment, Part 2: Heating rate dependence of temperature measurement, UserCom 54, 2/2021, 1-5.
- M Schubnell and D Regonin, Calibration and adjustment, Part 3: OIT and OOT applications, UserCom 55, 1/2022, 1-8.
- M Schubnell, D Regonini and N Fedelich, Calibration and adjustment, Part 4: Delamination, UserCom 56, 2/2022, 1-6.
- M Schubnell, The influence of water in solid materials, Part 1: Fundamentals and sorption behavior, UserCom 57, 1/2023, 1-7.
Return to MATS 347 home page
Created by John Summerscales on 06 March 2009 and updated on
24-Mar-2026 14:15. Terms and conditions. Errors and omissions. Corrections.