Different possible shapes for normal distributions, from the
StatsDirect webpage
| Quality Management and Safety Engineering (BSc) - MST 326 Basic statistics ... and ... Six-Sigma. |
"There are three kinds of lies: lies, damned lies and
statistics"
- attributed to Benjamin Disraeli (1804-1881) in Mark Twain, Autobiography,
1924, volume 1, page 246.
Basic statistics
In statistics, the term population is used to describe the entire collection
of data to be analysed.
The entire population is often too large to deal with, so two means of handling
this are random sampling or random assignment.
In random sampling, a sub-set of the population is
assumed to be representative of the whole population and the observations are
used to draw inferences about the whole population. The chosen sub-set
should contain the full range of characteristics of the population otherwise any
analysis will only be valid for the sub-set.
In random assignment, used when studying the
effects of some treatment variable, it is important that the subjects to be
treated are randomly assigned. Otherwise some recurrent characteristic
within the selected sub-set may over-ride the effects of the parameter being
studied and compromise the validity of the experimental results.
In order to quantify any effect we need to collect data appropriate to the problem to be analysed. For example, if we take all the one pound coins in the room and plot a histogram of their distribution against the issue date, it will appear as a ragged bar-chart starting in 1983 (before that we had one-pound notes) with gaps with no coins found for 1998/99 (unless it is from another state, e.g. Gibraltar). But if we know how many pound coins were minted in each year, we can calculate the proportion of those coins for each year. If we have a statistically meaningful sample, then the respective proportions should be close to the same number. We could undertake a similar analysis in respect of the design on the reverse or the inscription on the edge. The official figures for the number of one- and two-pound coins can be found on the Royal Mint website:
| Date | Quantity | Design | Inscription |
| 1983 | 443,053,510 | UK - Ensigns Armorial | Decus et Tutamen |
| 1984 | 146,256,501 | Scotland - thistle | Nemo Me Impune Lacessit |
| 1985 | 228,430,749 | Wales - leek | Pleidiol Wyf I'm Gwlad |
| 1986 | 10,409,501 | Northern Ireland - flax | Decus et Tutamen |
| 1987 | 39,298,502 | England - oak tree | Decus et Tutamen |
| 1988 | 7,118,825 | UK - a Shield of Our Royal Arms | Decus et Tutamen |
| 1989 | 70,580,501 | Scotland - thistle | Nemo Me Impune Lacessit |
| 1990 | 97,269,302 | Wales - leek | Pleidiol Wyf I'm Gwlad |
| 1991 | 38,443,575 | Northern Ireland - flax | Decus et Tutamen |
| 1992 | 36,320,487 | England - oak tree | Decus et Tutamen |
| 1993 | 114,744,500 | UK - Ensigns Armorial | Decus et Tutamen |
| 1994 | 29,752,525 | Scotland - lion rampant | Nemo Me Impune Lacessit |
| 1995 | 34,503,501 | Wales - dragon passant | Pleidiol Wyf I'm Gwlad |
| 1996 | 89,886,000 | Northern Ireland - celtic collar | Decus et Tutamen |
| 1997 | 57,117,450 | England - three lions | Decus et Tutamen |
| 1998 | - | UK - Ensigns Armorial | Decus et Tutamen |
| 1999 | - | Scotland - lion rampant | Nemo Me Impune Lacessit |
| 2000 | 109,496,500 | Wales - dragon passant | Pleidiol Wyf I'm Gwlad |
| 2001 | 58,093,731 | Northern Ireland - celtic collar | Decus et Tutamen |
| 2002 | 77,818,000 | England - three lions | Decus et Tutamen |
| 2003 | 61,596,500 | UK - Ensigns Armorial | Decus et Tutamen |
| 2004 | 39,162,000 | Scotland - Forth railway bridge | incuse decorative feature ... |
| 2005 | 99,429,500 | Wales - Menai bridge | ... symbolising bridges and pathways |
| 2006 | 38,938,000 | NI: MacNeill's Egyptian Arch | incuse decorative feature ... |
| 2007 | 26,180,160 | England: Gateshead Millenium Bridge | ... symbolising bridges and pathways |
| 2008 | 3,910,000 | Royal Arms | Decus et Tutamen |
| 2008 | 43,827,300 | Royal Shield | Decus et Tutamen |
| 2009 | 27,625,600 | Royal Shield | Decus et Tutamen |
| 2010 | 57,120,000 | Royal Shield | Decus et Tutamen |
| 2010 | 6,205,000 | capital city badges: principal focus Belfast | Pro Tanto Quid Retribuamus |
| 2010 | 2,635,000 | capital city badges: principal focus London | Domine Dirige Nos |
| 2011 | 25,415,000 | Royal Shield | Decus et Tutamen |
| 2011 | 1,615,000 | capital city badges: principal focus Cardiff | Y Ddraig Gooch Ddyry Cychwyn |
| 2011 | 935,000 | capital city badges: principal focus Edinburgh | Nisi Dominus Frustra |
| 2012 | 35,700,030 | Royal Shield | Decus et Tutamen |
| 2013 | 13,090,500 | Royal Shield | Decus et Tutamen |
| 2013 | 5,100,000 | floral emblem of England | Decus et Tutamen |
| 2013 | 4,930,000 | floral emblem of Wales | Pleidiol Wyf I'm Gwlad |
| 2014 | floral emblem of Ireland | Decus et Tutamen | |
| 2014 | floral emblem of Scotland | Nemo Me Impune Lacessit |
Table 1: Quantities, designs and inscriptions of one pound coins issued into general circulation
(compiled from
http://www.royalmint.com/RoyalMint/web/site/Corporate/Corp_british_coinage/CirculationFigures/Nickel-Brass.asp and
http://www.royalmint.com/RoyalMint/web/site/Corporate/Corp_british_coinage/CoinDesign/OnePoundCoin.asp and
http://www.royalmint.com/RoyalMint/web/site/Corporate/Corp_british_coinage/CirculationFigures/2003to2009.asp
on 15 February 2007 and
http://www.royalmint.com/discover/uk-coins/circulation-coin-mintage-figures/two-pounds-to-20p-issued on 24 July 2014).
This Excel spreadsheet will help us to visualise the data collected for coins in this survey as a histogram: a chart with bars that represent numbers of observations within certain ranges (bins) of values.
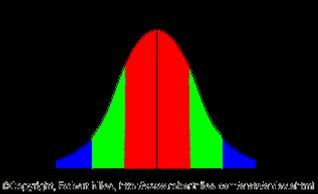
When a set of data corresponds to components made with a specific target value, there will often be a degree of variability around the mean. The standard normal distribution is the most important continuous probability distribution. It was first described by De Moivre in 1733 and subsequently by the German mathematician Gauss (1777 - 1885). Normal distributions are a family of distributions with a symmetrical bell shape. Most of the values occur in the middle of the curve and the area under each of the curves is the same:
Different possible shapes for normal distributions, from the
StatsDirect webpage
The width of the curve is quantified as the standard deviation, s, of a normal distribution. In Excel there are two different ways of deriving a standard deviation:
The variance is the square of the standard deviation, s2.
Another useful graphical technique is a Pareto chart: a bar chart where data is presented with the number of occurrences (or frequency) on the y-axis. The data is sorted such that whatever occurs most frequently is plotted on the left and whatever occurs least frequently is plotted on the right. In consequence, the bar lengths reduce from left to right. Vilfredo Pareto (1848-1923) was an economist who established that 80% of the land in Italy was owned by 20% of the population and subsequently realised that this principle was valid in other parts of his life. It is now often referred to as the 80/20 rule. The Pareto chart is especially useful for determining those defects which occur most often in products or processes and hence indicating where remedial effort would be best expended. The Pareto principle can be applied to quality improvement as the majority of problems (80%) are produced by a few key causes (20%).
URLs for on-line statistics tutorials and related materialsSIX SIGMA (Evans & Lindsay pp 595-602)
Six-Sigma is an approach to measuring and improving product and service quality credited to Bill Smith, a reliability engineer at Motorola, in the 1980s, who:
In 1987, Motorola set the following goals:
Six Sigma is a measure of quality that strives for near perfection - that the process has less than 3.4 defects per million opportunities. As the name indicates, the number of defect free operations corresponds to the area within ± six standard deviations (one standard deviation is denoted by sigma: σ) on a normal distribution curve. Six Sigma is a disciplined, data-driven approach and methodology for eliminating defects in any process or service activity. A Six Sigma defect is defined as anything outside of customer specifications [Source].
Evans & Lindsay Slides 12-17: Means shifted by 1.5 SD
In Six-Sigma, a defect is any mistake or error that is passed on to the customer (i.e. a nonconformance). Output quality then becomes
defects per unit (DPU) = number of defects discovered/number of units produced
although this definition appears too focussed on the final product rather than the process by which the product is generated. An alternative definition for quality performance is:
defects per million opportunities (DPMO) = DPU * 1 000 000/opportunities for error
and hence Six-Sigma quality equates to a maximum of 3.4 DPMO. In terms of the normal distribution, this can be visualised as three separate normal distributions with the respective means at -1.5σ, on target and +1.5σ such that the process mean only needs to be controlled within the range of the lower and upper mean to achieve Six-Sigma quality. If the process mean were always on the target mean, then only 2 defects per billion operations would be expected.
Six-sigma quality corresponds to a process variation equal to half of the design tolerance. Other quality levels can be defined such that the sigma-level is the distance from the target to the lower or upper specification limit (half the tolerance), hence for k-sigma quality:
k = tolerance/(2 * process standard deviation)
Now we can define a process capability index, Cp, sometimes called the process potential index:
Cp = the specification width/the natural tolerance of the process = (upper tolerance limit-lower tolerance limit)/6σ
which value of which increases with reduction of the spread (i.e. of the standard deviation). For k-sigma quality, Cp = 2kσ/6σ =k/3 and hence the value is 2 for six sigma quality or 1 for three sigma quality. A quality level of 3.4 DPMO can be achieved with different shifts between the upper and lower means combined with changes in the quality level:
A change from three- to four-sigma quality represents a 10-fold improvement, from four- to five sigma a 30-fold improvement, and from five- to six-sigma a 70-fold improvement.
No process can be maintained in perfect control:
Six-Sigma quality allows a shift of 1.5 standard deviations
from the target mean value.
If the target could be held, the expectation would be just 2.0
defects per billion operations.
General Electric [Evans & Lindsay p 599] used the Six-Sigma concept to achieve:
Citibank [Evans & Lindsay p 599]:
The core philosophy of Six-Sigma is based on:
At General Electric, a recognised benchmark for industry, the Six-Sigma approach uses DMIAC (a five phase problem solving approach) [Evans and Lindsay page 600]:
The key differences to other Total Quality Management approaches are the use of statistical methodologies and the emphasis on customer requirements. The key principles necessary for effective implementation of Six-Sigma are:
URLs for Six-Sigma (checked as live on 24 July 2014):
Books on Six Sigma