Composites Design and Manufacture: brief overviews
Characterisation of fibre-reinforced polymer composites by mechanical/non-destructive/thermal testing and microscopy
Rules-of-mixtures
The properties of fibre-reinforced composites can be estimated using rules-of-mixtures for
- modulus (or similar properties by substitution of the appropriate terms), or
- strength (e.g. Kelly-Tyson equation for unidirectional composites).
All these estimations rely on the fibre volume fraction (normally denoted as Vf or FVF). The determination of fibre volume fraction for man-made fibre composites can be achieved by various means:
- Curtis [1] adopted as ISO14127 Procedure A1 [2] suggested themal resin removal (burn-off).
- Moon et al [2a] proposed the use of thermogravimetric analysis (TGA) to determine FVF of CFRP and GFRP at an isothermal temperature of 550 °C. The carbon fibre also loses mass at this temperature so a fibre weight loss fraction parameter should be considered.
- Curtis [1] adopted as ISO14127 Procedure A2 [2] suggested chemical resin removal by nitric acid.
- Green [2b] proposed the use of a 600W domestic microwave oven with a Parr 4782 microwave digestion bomb and concentrated nitric acid (SG 1.42) to determine the FVF of CF/Ep composites.
- Curtis [1] adopted as ISO14127 Procedure A3 [2] suggested chemical resin removal by sulphuric acid/hydrogen peroxide,
- Curtis [1] adopted as ISO14127 Procedure B [2] suggested thickness measurement where Vf = n AF / ρf t,
where n = number of plies, AF = areal weight of each reinforcement layer, ρf = fibre density, and t = laminate thickness.
- Curtis [1] also suggested density measurement
- mesoscopic image acquisition, processing and analysis [3]. Thébault et al [4] have compared composites FVF measurements by five methods:
- Otsu's thresholding method is the most widely used image analsis technique for FVF. The image is thresholded to separate fibres from the matrix, then the FVF is the ratio of fibre pixels to the total number of pixels (i.e. the area fraction) in the image,
- watershed method treats the segmented input as a tpographic surface with pixel intensity values representing elevation. The algorithm simulates a flooding process where basins are filled until it reached a watershed level at high-intensity ridges,
- fiber counting assumes the fibre cross-sections are perfect ellipses with the mean area being the product (π a b) of the total number of fibres times the area computed from the average major (a) and minor (b) semi-axes of the detected elliptial shapes,
- machine learning segmentation model, and
- machine learning regression model.
Thébault et al concluded that "Otsu's thresholding proved reliable and efficient for most practical applications", except when FVF <5%.
For natural fibre reinforced composites, Jang et al [5] have proposed a modified burn-off method which selectively combusts natural fibres and quantifies the remaining resin mass.
mechanical properties
The mechanical properties of any material can be determined by loading the material and monitoring deformation or by deforming a material and monitoring
the loads required. In order to compare samples of different sizes we normalise the deformation and load so that:
- strain (ε) = deformation as a fraction of the original length,
- stress (σ) = load/the effective area carrying that load.
Strain is normally measured using electrical resistance strain gauges adhered to the sample surface. Gauges are available in a variety of lengths and usually 120- or 350-Ω: the latter are best suited to composites [6].
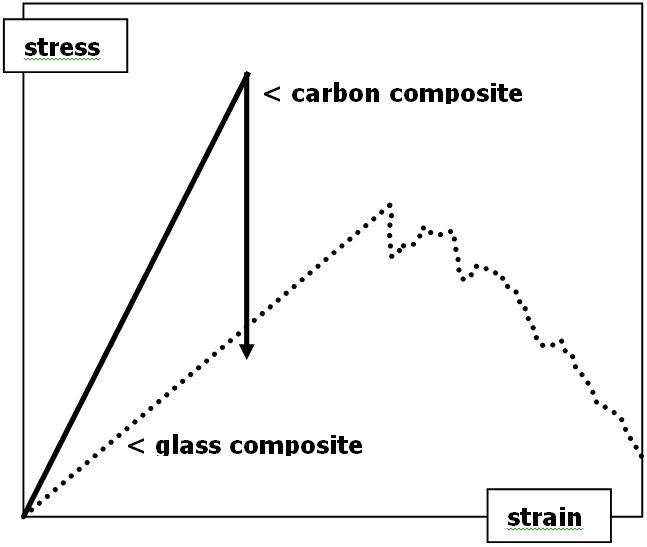
Figure 1: Typical stress/strain curves for carbon or glass fibre-reinforced plastics
We can then define the material by a number of elastic properties:
- Elastic modulus (E) = uniaxial stress/uniaxial strain (for the initial linear stress/strain plot),
- Poisson's ratio ν = - strain transverse to the load/strain parallel to the load,
- Shear modulus (G) = biaxial stress/biaxial strain (for the initial linear stress/strain plot),
- Bulk modulus (K) = triaxial stress (pressure)/triaxial strain (for the initial linear stress/strain plot).
For the isotropic case, there is one value for each of E, G, K and ν. These parameters are inter-related, so that for the isotropic case:
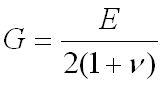 and
and 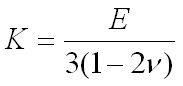
For the purposes of this brief introduction, assume that the composite is homogeneous (single phase) and orthotropic (different properties on each orthogonal axis) unless specifically stated otherwise. Where there is a laminate stacking sequence in the composite, more consideration should be given to the heterogeneous nature of the material especially if the material is in bending. For the orthotropic case, there are 3 orthogonal values for each of E, G, ν and a single value for K
with the respective equations for G [7] and K [8] being:
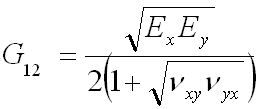 and
and 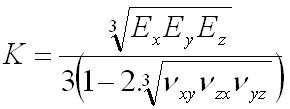
The parameters which characterise the failure are:
- Strain at failure (ε') = extension at failure/initial length,
- Strength (σ') = load at failure/initial area (but there may be more than one strength),
and while the value will be the same in all directions for isotropic materials (subject to some degree of statistical variation), it is necessary to specify the test axis for orthotropic materials.
International/national/industry standards exist for methods to determine the properties of composite materials [9]. The UK aerospace industry Composites Research Advisory Group has published a set of CRAG Test Methods [1], many of which have been adopted under the ISO banner. Before testing, the material should be conditioned [10-12] and characterised for fibre, resin, void and moisture contents [13-16]. It is important to observe the failure modes after testing as this can give clues to the major weaknesses in the combined materials. The principal forms of failure are matrix cracking, fibre/matrix debonding, inter-layer delamination, fibre fracture and fibre pull-out. Typical images of failures (fractographs) can be found in Bascom and Gweon [17].
Tension [18-22]
Perhaps the best indication of the properties of a material is obtained from a tensile test in which a specimen with parallel sides is caused to extend. It is usually necessary to add end-tabs (often aluminium or glassfibre) to prevent crushing damage in the grips of the testing machine and to introduce the load into the specimen with minimal stress concentrations [23-25].
Compression [26]
The compression test is essentially similar to the tension test except that the force is in the opposite sense (i.e. push instead of pull). An additional complication arises because of a further failure mode: for slender specimens buckling may occur. Most standard test techniques employ some form of anti-buckling guide to suppress this failure.
Flexure [27, 28]
If a beam is supported at the ends and the middle is then forced downwards, there will be a gradual change from maximum compression stress at the upper surface to maximum tensile stress at the lower surface.
The shear stresses will be minimum at the surface and maximum on the neutral axis (this axis is normally the centre-line between the two surfaces).
Where a beam is tested in three-point loading, there will be significant shear forces throughout the beam except at very high span/depth ratios.
In four-point bending, the region between the central rollers will be in pure bending with shear outboard of the rollers.
The optimum configuration for the determination of flexural modulus would be four-point bending with the deflection of the central section referenced to the loading rollers.
An alternative is strain gauges in this position.
In-plane shear properties [29, 30]
In pure shear, the plane is subjected to tensile forces on one axis and compressive forces of equal magnitude on the orthogonal axis. In simple shear loading, two parallel faces move in opposite parallel directions. Many different techniques have been proposed for the determination of the in-plane and through-plane shear properties with variations appropriate to composite plates, rods and tubes [31].
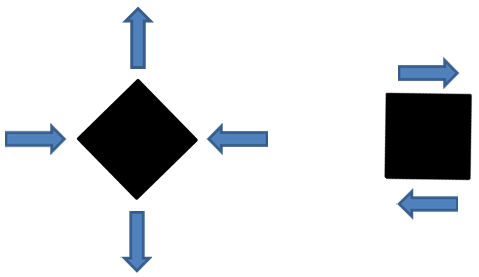
Figure 2: In pure shear, there is simultaneous longitudinal tension and transverse compression of equal magnitude (left)
while in simple shear, two parallel faces move in opposite directions (right)
Inter-laminar shear strength [32-33]
The inter-laminar shear strength (ILSS) test is a three-point bend test at very small span/depth ratio (typically 4/1 or 5/1). This parameter should not be used for design purposes. The test is often used to monitor the quality of the laminate: it normally measures the strength of the fibre/resin interface or of the resin rich area between the laminae. The value for a good composite may be around 50 MPa.
Creep
Creep is the time-dependent deformation of a material under a sustained load. It is normal to design the composite to avoid such deformation by:
- limiting the working temperature to below the glass transition temperature (Tg),
- using a thermoset matrix with a high cross-link density,
- maximising the cross-sectional area to minimise the stress,
- using the highest fibre modulus economically practicable,
- using the maximum fibre volume fraction economically practicable,
- orienting the fibres parallel to the stress direction,
- using the longest (preferably continuous) fibre available.
Fatigue
Fatigue is the time-dependent deformation of a material under a cyclic load. It is normal to undertake fatigue testing with a specific waveform (especially sine wave) or with pre-recorded deformations from a practical situation. In general, fatigue testing is undertaken from a small to a large percentage (e.g. 10-60%) of the ultimate (failure) load for the mode of testing. This usually avoids the complex gripping arrangements that are necessary for reversed cycle (tension and compression) loading.
Impact
For metals (which have a uniform microstructure) it is appropriate to use a pendulum impact machine (Charpy/Izod) to determine impact strengths and toughness.
However, in composites the crack often turns and runs parallel to the fibres until it finds a specimen edge. In such a situation, the machine will under-record the strengths. For composites, the preferred methods are drop-weight impact or ballistics using a larger sample such that the failure does not extend to the specimen edge.
Highly Accelerated Life Testing (HALT)
For the prediction of the suitability of a material over the complete lifetime of components, it would be useful to conduct Highly Accelerated Life Testing (HALT). Degradation mechanisms normally occur faster at higher temperatures, but if there is a change in the mechanism involved, then the data obtained may be misleading. ASTM D5229-92 [34] recommends that HALT should only be conducted up to 25°C below Tg.
Carson et al [35] prepared a report on accelerated life testing (ALT) for composite-unit sonar transducers.
Non-Destructive Testing (NDT) [36-39]
There are many situations where the sampling of material for discrete tests is inappropriate and non-destructive examination is preferred.
An example would be the determination of the extent of damage in an impacted panel.
There are a number of techniques that can give clues in this context.
X-radiography (pictures from X-rays) does not yield good images of carbon-fibre composites because the density difference between the fibre and the resin matrix is small.
Glass fibre composites can be imaged more clearly. Cracks running parallel to the X-ray beam will be clearly imaged in either material but are rare in composites.
Where there are surface-breaking cracks these can be imaged used penetrant-enhancement (e.g. silver iodide solution) but there may be concerns arising from composite-penetrant interactions.
Thermography: The differences in heat flows in a material can be imaged using thermal/infrared cameras (as used by emergency rescue teams).
A delamination in a composite will act as a barrier to the passage of heat. If viewed from the heated surface during a transient heating, the delaminated area will heat up more quickly than the surrounding area because of the broken thermal path to the
other surface. If heated from the opposite side, that area will heat up more slowly.
Ultrasound: Sound can travel as compression waves in fluids and as compression (longitudinal) or shear (transverse) waves in solids.
The different terminologies come from engineering (physics). To interrogate defects in composite materials, a high-frequency pulse (ultrasound) is input to the material and the returned signal analysed.
The trace of voltage against time is known as A-scan. Surfaces and defects reflect or scatter the pulse and hence influence the peak amplitude of the returned signal.
By scanning the transducer in the x-y co-ordinates, a colour map of the attenuated signal strength against position can be built.
This display is known as C-scan. For example, in the C-scan at Figure 2 light areas indicate a strong signal returned after passing through the plate in both directions while dark
regions indicate high attenuation of the signal due to absorption and scattering (the instrumentation used stretches the image along the x-axis).
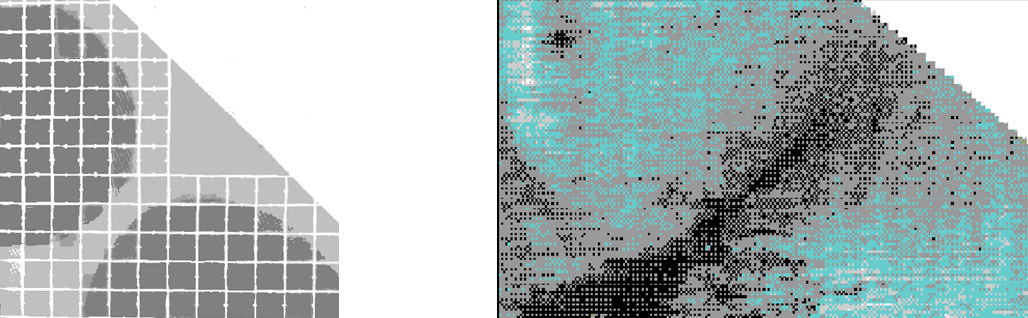
Figure 3: Video frame of flow fronts during mould fill (left) and ultrasound C-scan of the same area from the cured laminate (right)
Vibration: When an object is struck it will vibrate with a characteristic frequency and damping.
For example, a rail vehicle wheel will ring clear and long if it is defect free and sound dull and die quickly if there is a significant defect.
This is known as wheel-tap testing. An alternative is to use less energy and excite a more discrete area.
This technique is known as coin tapping after the excitation source used.
Other NDT techniques exist, but they do not find such common usage in composites structures.
Thermal Tests [40-49]
There are a number of thermal characterisation techniques:
- TGA: ThermoGravimetric Analysis measures weight changes in a material as a function of temperature (or time) under a controlled atmosphere to determine the thermal stability and composition,
- DTG: Derivative ThermoGravimetry,
- DTA (Differential Thermal Analysis) and DSC (Differential Scanning Calorimetry) measure the thermal transitions in materials by monitoring temperatures and heat flows.
DTA is qualitative while DSC is quantitative. Glass transition temperatures, phase changes, heat capacity, cure kinetics and thermal degradation can be monitored by these techniques.
Modulated DSC can be both faster and more accurate.
- DMTA: Dynamic Thermo-Mechanical Analysis measures the mechanical properties of materials under stress as a function of time, temperature, and frequency.
- DETA: Dynamic Electrical Thermal Analysis measures the electrical properties of materials as a function of time, temperature, and frequency.
- TMA: Thermo-Mechanical Analysis measures the change in dimensions or in a mechanical property of the sample while it is subjected to a temperature regime.
- Minimat is a miniature materials testing apparatus.
- STA: Simultaneous application of TGA and DSC to a single sample to yield more information than separate tests in different instruments.
Table 1: The role of the different thermal analysis techniques
(based on an unidentified supplier’s Thermal Analysis Application Guide)
| TGA |
DTA |
DSC |
DMTA |
DETA |
TMA |
Minimat |
| weight loss |
melt temperature |
melt temperature |
modulus |
dielectric constant |
thermal expansion |
modulus |
| moisture |
|
heat capacity |
compliance |
|
|
stress relaxation |
| |
|
heat of fusion |
viscosity |
|
|
stress optical |
| |
|
purity |
rheology |
rheology |
rheology |
rheology |
| |
glass transition |
glass transition |
glass transition |
glass transition |
glass transition |
glass transition |
| |
state-of-cure |
state-of-cure |
state-of-cure |
state-of-cure |
|
|
| |
|
cure kinetics |
cure kinetics |
cure kinetics |
|
creep |
| |
|
|
tan δ |
tan δ |
|
birefringence |
| |
crystallisation |
crystallisation |
crystallisation |
crystallisation |
crystallisation |
|
| chemical composition |
chemical composition |
chemical composition |
|
|
|
|
| catalyst activity |
catalyst activity |
catalyst activity |
|
|
|
|
| thermal stability |
thermal stability |
thermal stability |
|
|
|
|
| chemical stability |
chemical stability |
chemical stability |
|
|
|
|
| |
oxidative stability |
oxidative stability |
|
|
|
|
| decomposition kinetics |
decomposition kinetics |
decomposition kinetics |
|
|
|
|
| |
|
polymer compatibility |
polymer compatibility |
polymer compatibility |
|
|
Microscopy [3, 50-52]
Optical: Optical microscopy is normally considered to have a diffraction-limited resolution at around 250 μm although flourescence-based techniques (normally for biological materials) can achieve in-plane resolution of ~20μm and axial resolution of ~30μm [53]. For optimum resolution in optical microscopy it is necessary to produce an accurate flat surface which will sit normal to the optical axis of the microscope.
Specimens are normally individually potted in an epoxy casting resin and (at the University of Plymouth) prepared using a Buehler 2000 Metpol grinder/polisher with Metlap fluid dispenser according to the procedure shown in Table
2.
Table 2: Microscopical specimen preparation from Pearce et al [54]
| Step |
Platen |
|
|
|
Head |
|
Time (min) |
| |
Surface |
Abrasive |
Speed (rpm) |
Direction |
Speed (rpm) |
Force (N) |
|
| 1 |
SiC paper |
240 grit |
150 |
Complementary |
120 |
67 |
until plane |
| 2 |
SiC paper |
400 grit |
150 |
Complementary |
120 |
89 |
2 |
| 3 |
SiC paper |
600 grit |
150 |
Complementary |
120 |
89 |
2 |
| 4 |
SiC paper |
800 grit |
150 |
Complementary |
120 |
89 |
2 |
| 5 |
Nylon cloth |
6 μm diamond |
50 |
Contra |
120 |
133 |
5 |
| 6 |
Texmat cloth |
1 μm diamond |
100 |
Complementary |
60 |
133 |
5 |
| 7 |
Mastertex cloth |
AlSiO2 |
50 |
Contra |
60 |
22 |
2 |
Electron Microscopy: For most practical purposes the resolution limit of the optical microscope is 1 μm.
To see finer detail, and to increase the depth of field, it is necessary to image in an electron microscope.
For fractographic studies, the scanning electron microscope (SEM) detects back-scattered electrons and forms the image from that signal.
For detailed material characterisation the transmission electron microscope (TEM) may be used but this technique is rare in the analysis of polymer composite materials.
Images of unprepared specimens can be taken from low-vacuum SEMs, but for high magnification (which may be able to image individual atoms) it is usually necessary to achieve high vacuum levels.
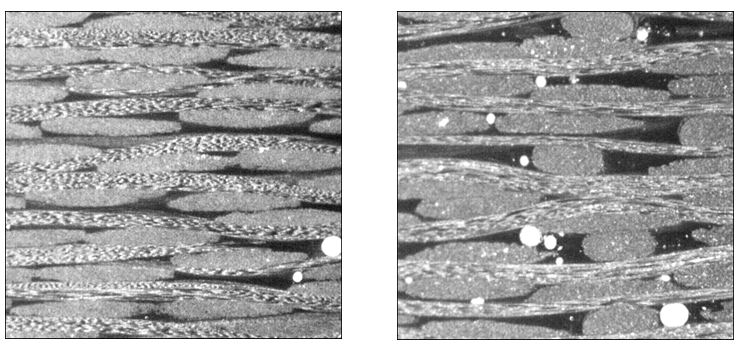
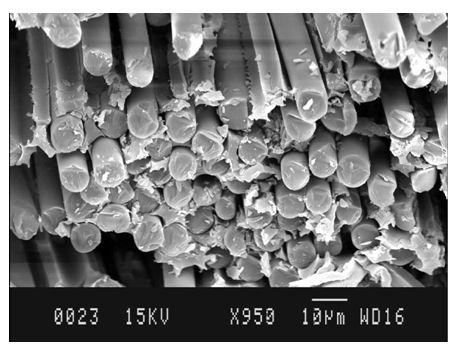
Figure 4: Optical micrographs of sections of carbon fibre satin weave fabric without (left) and with (centre) flow enhancing tows.
White areas are talc-filled surface breaking voids.
Electron micrograph of fractured glass fibre plain weave composite (right).
Wiley offer a series of free Essential Knowledge Briefs on advanced microscopy techniques [55-71]. NPL have Measurement Good Practice Guides for dimensional measurement using vision systems in microscopic and macroscopic imaging [72] and for the measurement of surface texture using stylus instruments [73]. Zeiss offer an Interactive Microscopy Laboratory and a guide to Diffraction Contract Tomography [74].
Spectroscopy
Work in progress! In 1928, Raman discovered that a small proprtion of light undergoes inelastic scattering in the medium with which it interacts with a change in wavelength (now known as the Raman effect). However, the technological development of efficient Raman spectroscopy systems was not implemented until lasers became available [75]. The technique observes vibrational, rotational and other low-frequency modes in chemicals to provide a structural fingerprint by which molecules can be identified. The bond vibration must produce a change in the polarisability of the molecule to be Raman active, so the technique is complementary to infrared spectroscopy. Entities with strong Raman responses tend to have weak IR responses and vice versa.
References
- PT Curtis, CRAG Test Methods for the Measurement of the Engineering Properties of Fibre Reinforced Plastics, Royal Aerospace Establishment Technical Report RAE-TR-88-012, February 1988 MooDLE.
- Anon., Carbon-fibre-reinforced composites — Determination of the resin, fibre and void contents, BS ISO 14127:2008, International Organization for Standards, Geneva ~ Switzerland, 1988.
[2a] C-R Moon, B-R Bang, W-J Choi, G-H Kang and S-Y Park, A technique for determining fiber content in FRP by thermogravimetric analyzer, Polyer Testing, May 2005, 24(3), 376-380.
[2b] P Green, Fibre volume fraction determination of carbon-epoxy composites using an acid digestion bomb, Journal of Materials Science, 1 October 1991, 1(19), 1162–1164.
- FJ Guild and J Summerscales, Microstructural image analysis applied to fibre composite materials: a review, Composites, 1993, 24(5), 383-393.
- F Thébault, A Clément, S Fréour, G Le Moal and P Casari, Comparison of fiber volume fraction measurement methods from composite micrographs, Composites Science and Technology, 26 July 2026, 282, 111689.
- J Jang, J-BRG Souppez and D Oh, Modified burn-off method for fiber content assessment in hemp and flax reinforced composites for marine structural applications, Polymer Testing, 2026, 157, 109139.
- SJ Thompson, RT Hartshorn and J Summerscales, Strain gauges on glass fibre reinforced polyester laminates, In IH Marshall (editor): Composite Structures 3, Elsevier, London, 1985, pp 748-759. PU CSH Library.
- MT Huber, The theory of crosswise reinforced ferroconcrete slabs and its application to various important constructional problems involving rectangular slabs, Der Bauingenieur, 1923, 4(12), 354-360 and 4(13), 392-395.
- J Summerscales, The bulk modulus of carbon fibres, Journal of Materials Science Letters, 2000, 19(1), 15-16.
- FT Traceski, Specifications and standards for plastics and composites, American Society for Metals, 1990. PU CSH Library.
- Plastics - standard atmospheres for conditioning and testing, BS EN ISO 291:1997.
- Aerospace series. Fibre-reinforced plastics. Standard procedures for conditioning prior to testing unaged materials. BS EN 2743:2002.
- Stephanie Bell, A beginner’s guide to humidity measurement (version for comment), National Physical Laboratory measurement guide, Teddington, October 2011.
- Carbon fibre laminates - determination of the fibre, resin and void contents. BS EN 2564:1998.
- Plastics - determination of water absorption. BS EN ISO 62:1999.
- Richard Rusby, A beginner’s guide to temperature measurement (version for comment), National Physical Laboratory measurement guide, Teddington, October 2011.
- Guide to Moisture analysis: moisture determination with the halogen moisture analyzer, Mettler Toledo AG, Greifensee - Switzerland, April 2013.
- WD Bascom and SY Gweon, Fractography and failure mechanisms of carbon-fibre-reinforced composite materials, in AC Roulin-Moloney (editor), Fractography and Failure Mechanisms of Polymers and Composites, Elsevier Applied Science, London, 1989. ISBN_1-85166-296-0. PU CSH Library.
- Plastics - determination of tensile properties, Part 1. General principles. BS EN ISO 527-1:1996.
- Plastics - determination of tensile properties, Part 4. Test conditions for isotropic and orthotropic fibre-reinforced plastic composites. BS EN ISO 527-41:1997.
- Plastics - determination of tensile properties, Part 5. Test conditions for unidirectional fibre-reinforced plastic composites. BS EN ISO 527-5:1997.
- Carbon fibre reinforced plastics. Unidirectional laminates. Tensile test parallel to the fibre direction. BS EN 2561:1998.
- Carbon fibre reinforced plastics. Unidirectional laminates. Tensile test perpendicular to the fibre direction. BS EN 2597:1998.
- DO Adams and DF Adams, Tabbing Guide for Composite Test Specimens, Federal Aviation Admin. Report DOT/FAA/AR-02/106, Office of Aviation Research, Washington DC, October 2002. NTIS AD A411 472.
- D Adams, Tabbing composite test specimens: when and why, High-Performance Composites, March 2011, 19(3).
- DO Adams, Tensile testing of composites: simple in concept, difficult in practice, Composites World, January 2015, 1(1), 10-11.
- BS EN ISO 14126:1999. Fibre-reinforced plastic composites - determination of compressive properties in the in-plane direction.
- BS EN ISO 14125:1998. Fibre reinforced plastic composites - determination of flexural properties
- BS EN 2562:1997. Carbon fibre reinforced plastics. Unidirectional laminates. Flexural test parallel to the fibre direction.
- BS ISO 1531:1999. Reinforced plastics - determination of the in-plane shear modulus by the plate twist method.
- BS EN ISO 14129:1998. Fibre-reinforced plastic composites - determination of the in-plane shear stress/shear strain response, including the in-plane shear modulus and strength by the ±45° tension test method.
- J Summerscales, Shear modulus testing of composites, Proceedings 4th International Conference on Composite Structures, Paisley, 27-29 July 1987. Elsevier Applied Science, 1987, volume 2, pp 305-316. PU CSH Library.
- Fibre-reinforced plastics - determination of the apparent interlaminar shear strength by short beam method. BS EN ISO 14130:1998.
- Carbon fibre reinforced plastics. Unidirectional laminates. Determination of apparent interlaminar shear strength. BS EN 2563:1997.
- Anon., Standard Test Method for Moisture Absorption Properties and Equilibrium Conditioning of Polymer Matrix Composite Materials, ASTM D5229/D5229M-20, ASTM International, 07 April 2020.
- DL Carson, Composite-Unit Accelerated Life Testing (CUALT) of Sonar Transducers, DTIC ADA085393, 01 September 1979.
- J Summerscales (editor), Non-Destructive Testing of Fibre Reinforced Plastics Composites, Kluwer Academic Publishers, Dordrecht, 1987/90. Volume 1: ISBN_1-85166-093-3. PU CSH Library. Volume 2: ISBN_1-85166-468-8. PU CSH Library.
- J Summerscales, NDT of advanced composites - an overview of the possibilities, British Journal of Non-Destructive Testing, 1990, 32(11), 568-577. MooDLE.
- J Summerscales, Non-destructive measurement of the moisture content in fibre-reinforced plastics, British Journal of Non-Destructive Testing, February 1994, 36(2), 64-72. MooDLE.
- J Summerscales, Manufacturing defects in fibre-reinforced plastics composites, Insight, 1994, 36(12), 936-942. MooDLE.
- DR Mulligan, S Gnaniah and G Sims, Thermal Analysis Techniques for Composites and Adhesives (Second Edition), National Physical Laboratory Good Practice Guide (GPG No. 62), Teddington, 2000. PU CSH Library.
- WM Groenewoud, Characterisation of polymers by thermal analysis, Elsevier, Amsterdam, 2001. ISBN_0-444-50604-7.
- PJ Haines, Principles of thermal analysis and calorimetry, Royal Society of Chemistry, Cambridge, 2002. ISBN_0-85404-610-0. PU CSH Library.
- Plastics - differential scanning calorimetry (DSC). Part 1: general principles. BS ISO 11357-1:1997.
- Plastics - differential scanning calorimetry (DSC). Part 2: determination of glass transition temperature. BS ISO 11357-2:1999.
- Plastics - differential scanning calorimetry (DSC). Part 3: determination of temperature and enthalpy of melting and crystallization. BS ISO 11357-3:1999.
- Plastics - differential scanning calorimetry (DSC). Part 5: determination of characteristic reaction curve temperatures and times, enthalpy of reaction and degree of conversion. BS ISO 11357-5:1999.
- Plastics - thermogravimetry (TG) of polymers. General principles. BS EN ISO 11358:1997.
- Plastics - thermomechanical analysis (TMA). General principles. BS ISO 11359-1:1999.
- Plastics - thermomechanical analysis (TMA). Determination of coefficient of linear thermal expansion and glass transition temperature. BS ISO 11359-2:1999.
- J Summerscales (editor), Microstructural Characterisation of Fibre-Reinforced Composites, Woodhead Publishing, Cambridge, 1998. ISBN_1-85573-240-8. PU CSH Library.
- FJ Guild and J Summerscales, Microstructural image analysis applied to fibre composite materials: a review, Composites, 1993, 24(5), 383-394. MooDLE.
- BS Hayes, Optical Microscopy of Fiber-Reinforced Composites, ASM International, May 2011. ISBN_978-1-61503-044-6. PU CSH Library.
- T Allen, Microscopy: A Very Short Introduction, Oxford University Press, Oxford, 2015. ISBN: 978-0-19-870126-2.
- NRL Pearce, FJ Guild and J Summerscales, The use of automated image analysis for the investigation of fabric architecture on the processing and properties of fibre-reinforced composites produced by RTM, Composites Part A: Applied Science and Manufacturing, July 1998, 29(7), 829-837.
- An Overview of 3D X-ray Microscopy ~ second edition, John Wiley/Zeiss, Chichester, 2020.
- Atom Probe Tomography, John Wiley, Chichester, 2017.
- Atomic Force Microscopy for Materials, John Wiley, Chichester, 2017.
- Correlative Light & Electron Microscopy, John Wiley, Chichester, 2013.
- Correlative Microscopy in Materials Science, John Wiley, Chichester, 2017.
- Electron Backscatter Diffraction - second edition, John Wiley, Chichester, 2015.
- Electron Probe Microanalysis, 2015.
- Energy Dispersive Spectroscopy, John Wiley, Chichester, 2014.
- Focused Ion Beam-Scanning Electron Microscopy, John Wiley, Chichester, 2017.
- Ion Chromatography, John Wiley, Chichester, 2016.
- Light Sheet Microscopy - second edition, John Wiley, Chichester, 2015.
- Micro X-ray fluorescence spectroscopy, John Wiley, Chichester, 2017.
- Raman Microscopy, John Wiley, Chichester, 2017.
- Super-Resolution Microscopy, John Wiley, Chichester, 2013.
- Super-Resolution Microscopy ~ second edition, John Wiley, Chichester, 2018.
- Wavelength dispersive (X-ray) Spectroscopy, John Wiley, Chichester, 2016.
- X-ray Photoelectron Spectroscopy, John Wiley, Chichester, 2016.
- T Coveney, Dimensional measurement using vision systems, NPL Measurement Good Practice Guide 39, National Physical Laboratory, Teddington, August 2014. ISSN:1368-6550.
- RK Leach, The measurement of surface texture using stylus instruments, NPL Measurement Good Practice Guide 37, National Physical Laboratory, Teddington, February 2014. ISSN:1368-6550.
- Diffraction Contrast Tomography: unlocking crystallographic information from laboratory X-ray microscopy, Carl Zeiss, Pleasanton CA, October 2017.
- Raman spectroscopy explained, Booklet L9836-9033-01-D, Renishaw plc, Wotton-under-Edge, September 2018.
Created by John Summerscales on 18 August 2005 as a Word document, converted to HTML on 13 October 2011 and updated on
31-Jul-2026 12:03. Terms and conditions. Errors and omissions. Corrections.